Changes in torque and drag can develop over several stands before their operational impact becomes obvious. Increasing rotational resistance can affect rotary drilling performance, while increasing axial resistance can limit pipe movement and the transfer of weight to the bit. Both deserve continuous attention as the well progresses.
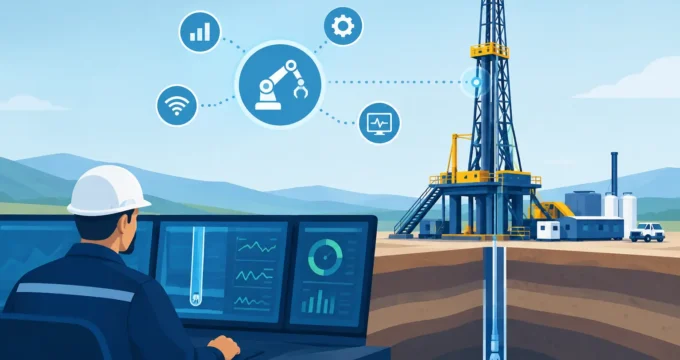
Cyberloop connects rig data, real-time torque-and-drag analysis and directional information within one ecosystem. The driller receives operational information through the Cyberloop EDR HMI at the rig, while engineers in the office access operational data and engineering views through the Cyberloop cloud portal. The Auto T&D module supports this workflow with real-time torque-and-drag charts, helping teams assess changing mechanical behavior as operations progress.
Why both torque and drag matter
Torque and drag describe two complementary aspects of drillstring interaction with the wellbore. Torque reflects resistance encountered during rotation. Drag is the axial resistance encountered when moving the drillstring up or down, affecting pickup and slack-off loads and the ability to transfer weight downhole.
Surface torque measurements help teams assess rotational loading. Hookload measurements, interpreted against expected string weight and comparable operating conditions, help teams assess axial drag. Hookload itself is not a direct measurement of drag: buoyancy, pressure effects, pipe movement and operating state must also be considered.
Increasing torque can constrain rotation and load the rotary system. Increasing drag can make tripping more difficult, reduce effective weight transfer and complicate directional execution. Either trend can become operationally significant even when the other remains relatively stable.
Reviewing both provides a more complete mechanical picture. Neither independently diagnoses the cause of a change; interpretation requires the trajectory, BHA, mud properties, drilling activity and other available measurements.
Cyberloop EDR: shared visibility at the rig and in the cloud
Cyberloop EDR provides the operational data foundation for torque-and-drag assessment. Surface torque and hookload can be reviewed alongside RPM, weight on bit, depth, block movement, standpipe pressure, flow rate and rate of penetration, depending on the available rig instrumentation.
At the rig, the EDR HMI supports the driller’s immediate assessment of operating conditions. In the office, the cloud portal allows engineers to review the developing trends and provide support using the same underlying operational data. This shared visibility strengthens communication between the rig and engineering team when a change requires investigation.
Connecting directional execution with mechanical response
Well trajectory directly influences drillstring contact, friction and the transfer of weight to the bit. As inclination, wellbore length and curvature change, the expected torque-and-drag response changes with them.
Cyberloop’s directional drilling suite, CYBERSTEER, automatically calculates the well trajectory from survey data and updates it across the CYBERSTEER application, the EDR HMI and the cloud portal. This gives the rig crew and office engineers a single, consistent trajectory dataset in real time, keeping the whole team aligned as the well progresses.
With this shared trajectory information, drillers and engineers can review wellbore geometry alongside torque and drag trends, helping them assess whether changing rotational or axial resistance is consistent with the trajectory or requires further investigation.
A directional view does not independently diagnose tortuosity or hole condition. It provides essential context for interpreting the operational measurements.
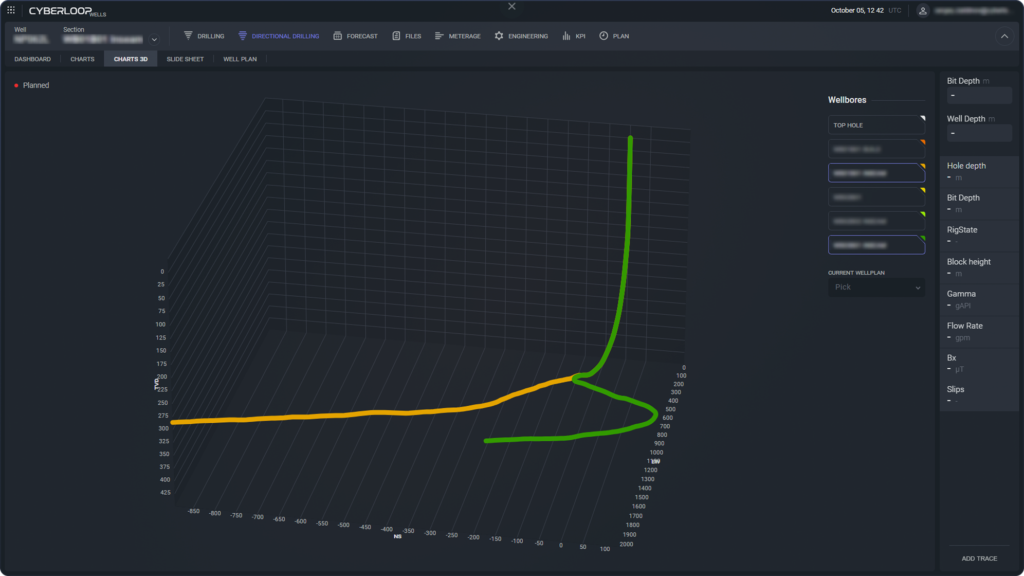
Figure 1. Three-dimensional directional wellbore visualization in the Cyberloop portal, providing trajectory context for operational and engineering review.
Auto T&D: real-time charts for drillers and engineers
Cyberloop’s Auto T&D module provides real-time torque-and-drag charts that help teams follow mechanical behavior as the well progresses. Depth-based torque and hookload views make it easier to assess developing patterns than relying on individual readings alone.
Torque trends support assessment of rotational resistance and changes in rotary loading. Hookload trends support assessment of pickup and slack-off behavior, axial resistance and weight-transfer limitations when interpreted under appropriate operating conditions.
For the driller, access to this information supports assessment of changing resistance and the well’s response to operating adjustments. For engineers in the office, the cloud view supports review of trends across depth, investigation of deviations and discussion of the appropriate response with the rig team.
Torque and hookload should be interpreted together and compared under equivalent operating conditions. Drilling ahead, rotating off bottom, reaming and moving pipe produce different mechanical responses. A change in activity can explain a change in the readings; a sustained departure under comparable conditions deserves closer attention.
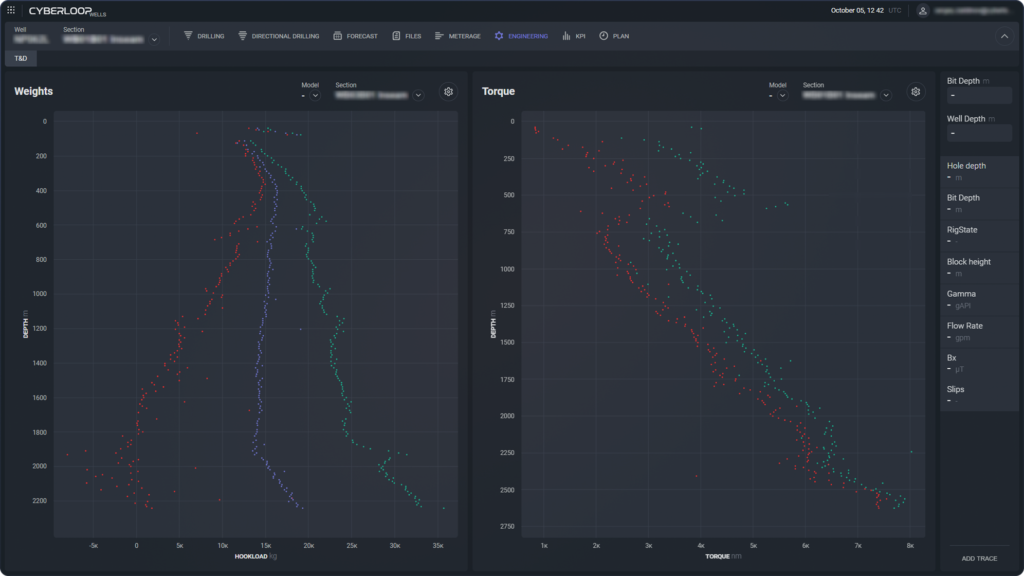
Figure 2. Torque-and-drag view from real operations in the Cyberloop portal, showing hookload and surface torque plotted against depth. The hookload view supports assessment of axial behavior, while the torque view shows rotational loading.
The objective is to understand whether both rotational and axial behavior remain consistent with the operation, trajectory and established baseline. Expected high torque or drag may be manageable; an unexplained departure from the expected response warrants attention.
Turning trends into informed decisions
A sustained torque increase with relatively stable axial behavior may prompt review of rotary drilling conditions, BHA response or formation interaction. Increasing pickup or slack-off resistance with relatively stable torque may prompt closer assessment of pipe movement, weight transfer and localized resistance.
When torque and drag increase together, the team should assess the wider operating picture, including hole cleaning, cuttings accumulation, wellbore geometry and potential restrictions. These patterns guide investigation rather than establish a diagnosis.
Cyberloop EDR and Auto T&D help bring these observations into the operating discussion. The team can review what changed, when it changed and which other parameters changed with it.
Depending on the findings, the drilling team may review RPM, weight on bit, flow rate, rotation and pipe movement practices or reaming requirements. Engineers may reassess hydraulics, mud properties, BHA assumptions and the expected torque-and-drag response. Adjustments should follow the agreed operating procedures and equipment limits, with their effects evaluated against both rotational and axial response.
The charts support this assessment; they do not independently establish the cause of an abnormal condition or replace drilling judgment.
A foundation for advisory and automation
Reliable monitoring is also a foundation for more advanced drilling advisory and automation. Cyberloop’s ecosystem connects operational visibility, engineering interpretation and rig-control capabilities, allowing these functions to be developed in stages.
Auto T&D supports monitoring and decision-making. Where a separate automation solution is implemented, control actions require defined operating envelopes, validated signals, equipment interfaces and clear operator authority.
Data quality remains fundamental throughout: correct units and scaling, dependable timestamps and suitable acquisition frequency are necessary for meaningful analysis. Cloud connectivity and latency also determine how effectively office engineers can support the operation.
Measuring value through drilling outcomes
The value of real-time torque-and-drag monitoring should be assessed through operational results. Relevant measures include time spent reaming or managing hole conditions, torque-related interruptions, time spent managing excessive drag, tripping time, consistency of weight transfer and the speed of investigation when abnormal trends appear.
With Cyberloop EDR, Auto T&D and the cloud portal, drillers and engineers gain a connected view of rig measurements, mechanical response and directional execution. Reviewing torque and drag together helps teams recognize changing rotational and axial resistance, coordinate a response and evaluate its effect as the well progresses.
Contact Cyberloop to explore EDR, Auto T&D and cloud visibility for your drilling operations.